How will I access my [service]'s data history from Amazon Athena?

1. Access Amazon Athena
🖱 In your web browser, log in to your AWS account, navigate to the AWS Management Console, and open Amazon Athena.
👉 First time Amazon Athena users should start here ► DAP⇨flow📚Amazon Athena
2. Understanding your [service raw zone] database
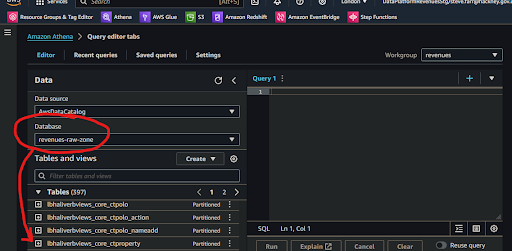
🖱 Ensure you have selected your [service raw zone] from the list box under the "Database" section on the left side of the Athena interface.
Fig. 2 & 3 
👉 Your Service Terms[] are defined in the welcome document stored in your [service access group] Google Drive subfolder.
💡 Athena’s databases are actually catalogs of the data stored in the AWS S3 storage buckets and folders, which we collectively call a data lake. From the top level, data lakes are divided by zone, then by service, then by service database.
💡 The service database folders are represented by databases in Athena that are labeled in the reverse service-database-zone format. The zone suffix labeling has the following meaning:
...-raw-zonefor databases where data tables arrive after they are ingested from a service database and whose specification depends upon the source of that data....-refined-zonefor databases where data goes whenever it is transformed and whose specification is implemented by data analysts and engineers when developing their data pipelines....-trusted-zonefor databases containing the product tables whose specification is developed and agreed upon by data analysts and engineers in collaboration with their data users.
👉 For more information on how Amazon S3 organizes data, see ►here
3. Explore the tables in your database
🖱 Beneath the "Database" section on the left of the Athena interface, expand the "► Tables" section to find the list of tables available from your [service raw zone] database.
-
This is how Athena presents tables from the S3 data lake. In S3’s folder structure, tables are represented by folders below the service database folder.
-
In this implementation, the table names were all suffixed
..._historyto remind us that each table contains several daily generations of data stretching back in time.
4. Expanding each table
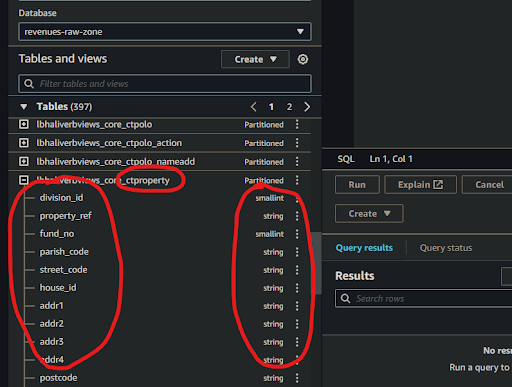
🖱 Click on each table name to expand it and observe the complete list of columns for that table.
Fig. 4 & 5 
5. Verifying the views and columns
👁 Compare each table and its columns with the equivalent table and columns from your [service database] to observe how their names and data types match up with their counterparts.
-
Occasionally the automatic data type translation will yield unexpected results. Always check columns to ensure there will never be any data lost. For example, if integer precision is lost.
-
Be especially aware of date translations. Dates are sometimes transmitted in specialized formats, possibly numerical or possibly textual. If we’re unlucky these might need some coded reconciliation afterwards to make them both readable and useful in computations, especially when used in comparison, or used to join date columns from tables elsewhere.
6. Observing the partition columns
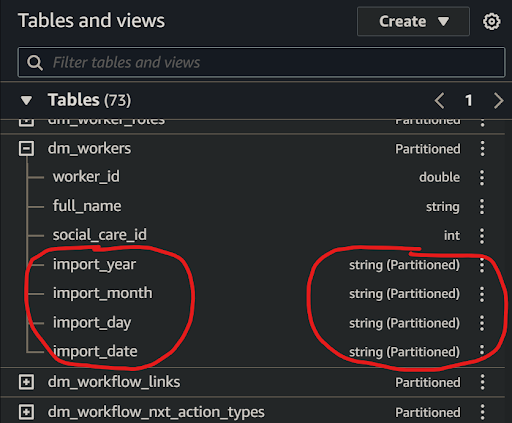
🖱 Scroll to the bottom of the column list to find the partition scheme. This will comprise three, or four, or more partition columns shown with the partition data type alongside eg. string (Partitioned).
Fig. 6 
💡 Traditional databases versus a data lake
It helps to become familiar with the fundamental differences between a traditional database and a data lake that records the entire history of our data.
-
Because tables are ingested or otherwise transformed daily (the most common frequency), each table folder, in the S3 data lake, must be subdivided by it's generation, so the underlying technology of the data platform can quickly access either current data, or specified previous data, needed for transformations.
-
Generations are organized hierarchically using S3 folders represented by the following partition column strings:
- Year eg.
import_yeareg. ‘2024’ (the current year) - Month eg.
import_montheg. ‘06’ (the current month eg. June) - Day eg.
import_dayeg. ‘05’ (5th day of the current month) - Date eg.
import_dateeg. “20240605” (5th June 2024)
We might see alternatives to
import_…column prefixes such astransform_…orgeneration_…, or observe combinations of generation the prefixes, to indicate data imported and transformed at different times. - Year eg.
-
We may observe other non-generational partition types, for example, we might want to subdivide the data after it is ingested in some other useful way, eg. by currency or historicity to facilitate data governance management or optimize our data pipelines in some way.
👉 So that Data Analysts are not overwhelmed by the data partitioning scheme, and can avoid using complex generational sub-queries in their transformations, a better solution was developed. The product of that development is documented here ► DAP⇨flow📚My current service data
"We ♡ your feedback!"

👉 Please use this link ► DAP⇨flow UX Feedback / access-my-service-data-history
-
Your feedback enables us to improve DAP⇨flow and our Data Analytics Platform service.
-
We encourage all our users to be generous with their time, in giving us their recollections and honest opinions about our service.
-
We especially encourage our new users to give feedback at the end of every 📚Onboarding task because the quality of the onboarding experience really matters.
☝ Please use this link to help us understand your user experience!
📚UX Criteria
- AWS Management Console user
- Hackney
[service]Data Analyst - Hackney
[service database]user
How will I access my [service]'s data history from Amazon Athena?
Measures the behavior of Amazon Athena while users explore their [service raw zone] database tables and columns:
Given I selected my [service raw zone] database in the Amazon Athena interface
When I explore the list below “Tables”
~and expand each table name to list its columns
Then I should find table names equivalent to tables from my [service database] with the suffix ..._history added
~and find equivalent column names with their respective equivalent data types
~and I should observe every table has partition columns added, eg. import_date.
Scale of 3 ~and flow features.